我从这篇文章下载了 GraphApplica
tion 来试用 Graph Widget。
https://community.st.com/s/question/0D50X0000ALvsTfSQJ/how-to-start-using-the-graph-widget-from-touchgfxopenrepository-in-touchgfx-designer
在将必要的代码添加到我的 Screen1View.cpp 并导入这些文件后,我正在使用
STM32F429i-Discovery Board 来显示此图,
Graph.hpp, GraphLine.hpp, AbstractGraph.hpp,
Graph.cpp、GraphLine.cpp、AbstractGraph.cpp。
该图仍未显示在我的 Screen1View 上。在显示屏上,它只显示来自 GraphApplication 示例的蓝色背景图像。
这是我的代码。
- File Screen1View.hpp
- #ifndef SCREEN1VIEW_HPP
- #define SCREEN1VIEW_HPP
- #include
- #include
- #include
- class Screen1View : public Screen1ViewBase
- {
- public:
- Screen1View();
- virtual ~Screen1View() {}
- virtual void setupScreen();
- virtual void tearDownScreen();
- virtual void handleTickEvent();
- protected:
- int tickCounter;
- Graph graph;
- };
- #endif // SCREEN1VIEW_HPP
- File Screen1View.cpp
- #include
- static int randomNumberBetween(int lowest, int highest);
- static int randomNumberBetween(int lowest, int highest)
- {
- #ifdef SIMULATOR
- return lowest + (highest - lowest) * rand() / RAND_MAX;
- #else
- uint32_t random = (touchgfx::HAL::getInstance()->getCPUCycles() * HAL::getInstance()->getCPUCycles());
- return lowest + (random % (highest - lowest));
- #endif
- }
- Screen1View::Screen1View()
- {
- }
- void Screen1View::setupScreen()
- {
- //Screen1ViewBase::setupScreen();
- // Place the graph on the screen
- graph.setXY(20, 20);
- // Set the outer dimensions and color of the graph
- graph.setup(440, 200, Color::getColorFrom24BitRGB(0xFF, 0xFF, 0xAC));
- // Set the range for the x and y axis of the graph. That is
- // the max and min x/y value that can be displayed inside the
- // dimension of the graph.
- graph.setRange(0, 50, 0, 200);
- // Set the line width in pixels
- graph.setLineWidth(2);
- add(graph);
- }
- void Screen1View::tearDownScreen()
- {
- Screen1ViewBase::tearDownScreen();
- }
- void Screen1View::handleTickEvent()
- {
- // Number of ticks between inserting a point in the graph
- int interval = 5;
- tickCounter++;
- if (tickCounter % interval == 0)
- {
- // Insert a point in the graph.
- // The Y value is a random number in the y range of the graph.
- graph.addValue(tickCounter / interval, randomNumberBetween(graph.getRangeBottom(), graph.getRangeTop()));
- }
- if (tickCounter == 37 * interval)
- {
- // Change the range of the Y axis
- graph.setRange(0, 50, 0, 400);
- graph.invalidate();
- }
- if (tickCounter == 50 * interval)
- {
- // Reset the graph and start over
- graph.setRange(0, 50, 0, 200);
- graph.setLineWidth(2);
- graph.clear();
- graph.invalidate();
- tickCounter = 0;
- }
- }
附上我的项目。只需解压工作区,打开 workspace1GraphTestSTM32CubeIDE.cproject 并使用 workspace1 作为工作区目录。

编辑 1:
我发现我应该在 main.c 中添加一个画布缓冲区,我将尝试将示例 main.cpp 转换为 main.c
编辑 2:
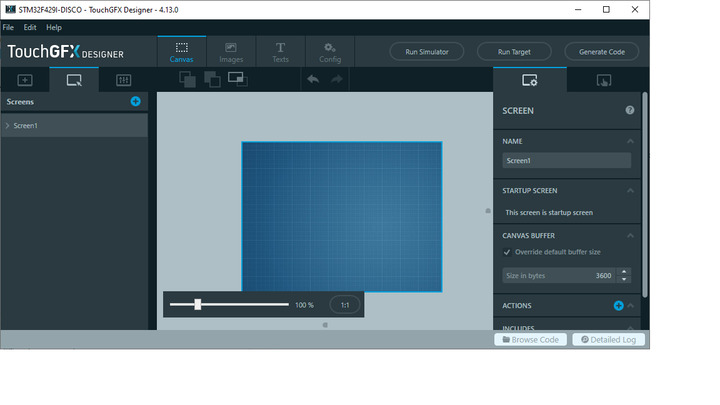
我通过TouchGfx designer给screen 1添加了canvas buffer 3600,终于开始出现图线了!


 举报
举报

